Steven Wieting, Global Chief Investment Strategist Phil Watson, Head of the Global Investment Lab Kris Xippolitos, Global Head of Fixed Income Strategy
With the global economic expansion likely to continue for longer than the consensus expects, we recommend remaining overweight equities and other risk assets. Even more important than this intermediate-term portfolio positioning, though, is the composition of our long-term recommended asset allocations. By combining prudent exposures to risk assets and a globally diversified asset allocation, investors can build an enduring investment portfolio. We think it is important they do so now.
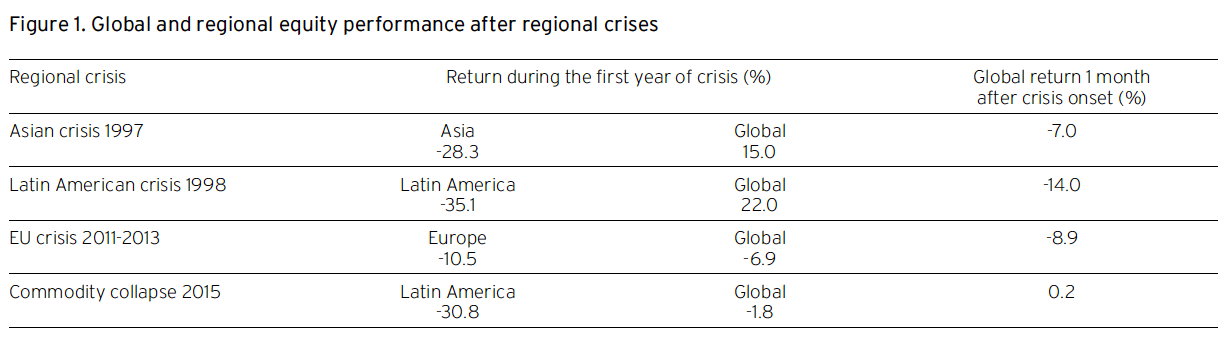
So, what exactly is an enduring portfolio? We define it as one that can withstand local or regional difficulties and even most catastrophes. Examples of these include major political shocks such as presidential impeachments, commodity price slumps, financial crises and economic downturns. Over time, there have been many regional crises that have initially impacted markets both regionally and globally. Typically, though, markets outside of the affected region have gone on to outperform strongly on a one-year view, providing examples of the value of diversification for investors wise enough to have an enduring portfolio – figure 1.
Source: Haver, as of 8 May 2018. Indices are unmanaged. An investor cannot invest directly in an index. They are shown for illustrative purposes only and do not represent the performance of any specific investment. Index returns do not include any expenses, fees or sales charges, which would lower performance. Past performance is no guarantee of future results. Real results may vary.
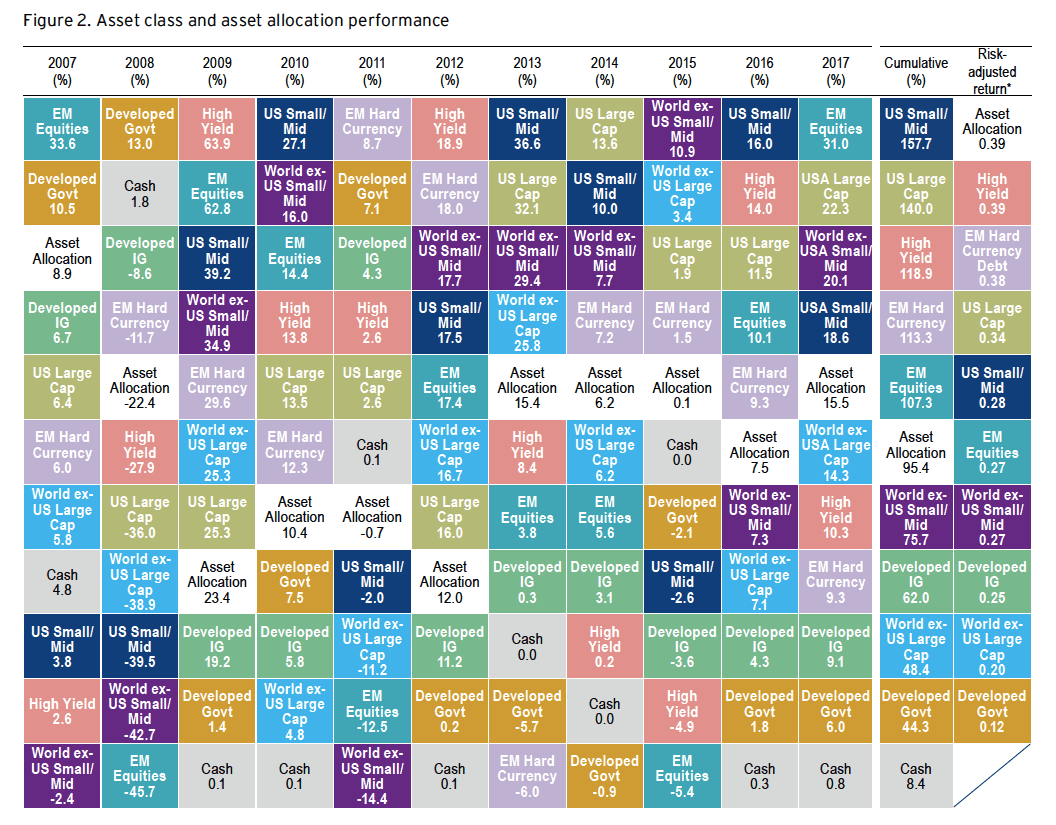
Global diversification is the cornerstone of every enduring portfolio. This involves holding a broad selection of different asset classes and sub-asset classes across countries worldwide. Actual events and resulting data suggests that this is no mere theoretical exercise. Decades of financial history have repeatedly demonstrated that globally diversified portfolios are likelier to produce attractive risk-adjusted returns than other concentrated portfolios. To see an enduring portfolio in action, consider the performance of major asset classes and sub-asset classes between 2007 and 2017.
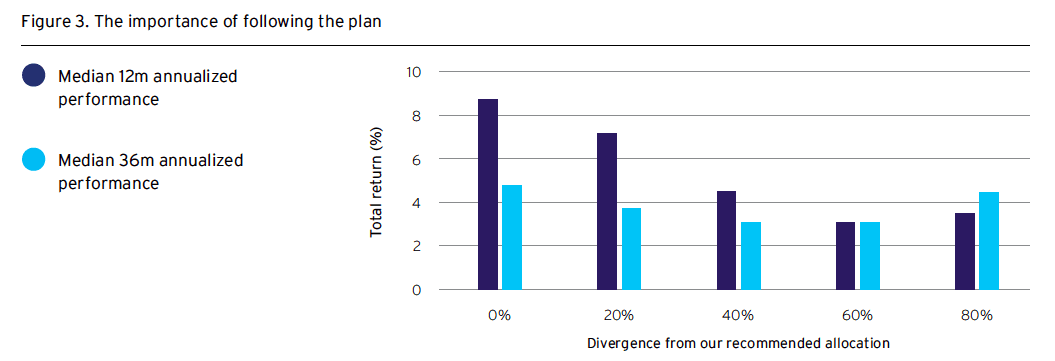
The highest risk-adjusted performance – as measured by the Sharpe ratio – would have been achieved by a globally diversified allocation aligned at an asset class level to Citi Private Bank’s AVS Risk Level 3 allocation in US dollars – figure 2. Even in the aftermath of the Global Financial Crisis of 2008-09 – during which the global equity total return index fell 54% – the same global allocation proved enduring, suffering no net decline when measured over a 5-year or longer time period. Looking simply at returns, client portfolios that have most closely followed our recommended globally diversified asset allocations have generally outperformed those that have not over the last one- and three-year periods – figure 3.
Source: Citi Private Bank, Bloomberg, as of 10 May 2018. See glossary for asset class definitions. Indices are unmanaged. An investor cannot invest directly in an index. They are shown for illustrative purposes only. Past performance is no guarantee of future returns. Real results may vary. Adaptive Valuation Strategies (AVS) is the Private Bank’s proprietary strategic asset allocation methodology. “Asset allocation” in this diagram represents an AVS Risk Level 3 allocation, which includes allocations to equities, fixed income, commodities, cash and hedge funds. Risk levels are an indication of clients’ appetite for risk. Risk Level 3 – Seeks modest capital appreciation and, secondly capital preservation. The returns shown were calculated at an asset class level using indices and do not reflect fees, which would have reduced the performance shown.
Source: Citi Private Bank Global Investment Lab, as of 1 May 2018. Divergence from our recommended allocation measures the degree to which clients’ portfolios follow our recommended allocations at all risk levels. The lower the percentage divergence, the more aligned the portfolios with our recommended allocations. A reading of 0% indicates full alignment with our recommendation. This information is drawn from the Private Bank’s proprietary data covering client portfolios in comparison to AVS allocations. Past performance is no guarantee of future returns. Real results may vary.
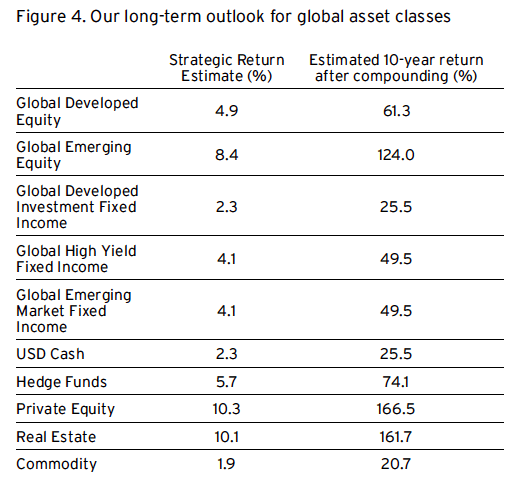
Despite these financial history lessons, we find that many clients continue to be invested predominantly in just a couple of asset classes. Fewer than one in five clients has a portfolio that is broadly diversified across asset classes and investment types. They also typically do not diversify internationally, with 91% of their holdings concentrated in a single currency. Such ‘home biased’ portfolios, concentrated in certain asset classes, are always riskier. In our view, they look especially vulnerable amid today’s more polarized, less global political and economic environment. Our advice is to address this vulnerability right now by implementing a carefully considered portfolio drawn from the global asset classes shown in figure 4, taking advantage of the valuation disparities we see across the world.
As well as being globally diversified, an enduring portfolio harnesses the power of time in the markets. Over the long run, compound returns – the result of reinvesting dividends and coupon payments – can be enormous.
The experience of US equities provides a good example. Since 1970, US equities have returned an average of 8% a year in simple price terms. But with dividends and the reinvestment of dividends, this becomes 12% a year. Even over the past three decades, when US dividend payout ratios have been historically low, the growth and reinvestment of dividends accounted for half of US equities’ total return. Our estimates of compound returns from each asset class over the next ten years are shown in figure 4.
Source: Citi Private Bank Quantitative Research team, Strategic Return Estimates are based on data as of 31 Dec 2017. Returns are estimated in US Dollars. All estimates are expressions of opinion and are subject to change without notice and are not intended to be a guarantee of future events. Strategic Return Estimates are no guarantee of future performance. Past performance is no guarantee of future returns. Real results may vary. AVS uses index returns to proxy for each asset class. Please see Glossary for definition of terms.
As you can see, there are major differences in estimated returns and the relative investment value of different assets classes. Ten-year strategic return estimates, like the ones shown above, assume that there will be economic slowdowns, recessions and other significant events over that period. When such events occur and the forward-looking strategic values change, enduring portfolios are rebalanced to gain greater exposure to cheaper assets. Enduring portfolios remain invested and are regularly reallocated. Holding many asset classes over long periods of time also help.
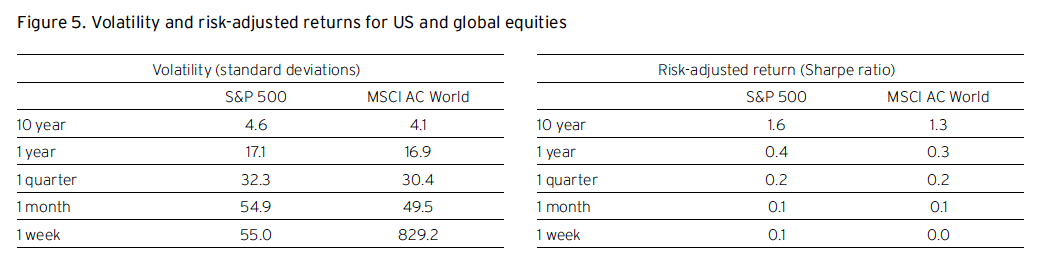
Investors with shorter holding periods lose the benefits of diversification and rebalancing and actually expose their portfolios to higher risk. Figure 5 shows volatility (standard deviation) and risk-adjusted returns (Sharpe ratio) for both US and global equities over various historical time periods. The shorter the holding period, the higher the volatility and the weaker the risk-adjusted returns. The same applies with fixed income. Trading a bond over a short-period does not allow the security to earn accrued interest. The advantage of taking a ten-year view – as our strategic asset allocation methodology does – is obvious.
Although the evidence for staying the course with risky assets is compelling, many investors take the opposite approach. They switch aggressively between risky assets and cash in an effort to maximize upside while trying to avoid significant drawdowns. Far from increasing portfolio returns or decreasing risk, however, market timing can all too easily have the opposite effect. Very often, investors who seek to time the markets base their decisions on ‘instinct’ or their reading of ‘market psychology.’ What typically happens, though, is that market timers fall victim to greed and fear themselves, and end up both sitting in cash for too long and/or taking excessive risk exposures too late into a bull market.
Source: Factset as of 10 May 2018. Covers period from 1988 to 2018. See glossary for definitions. Indices are unmanaged. An investor cannot invest directly in an index. They are shown for illustrative purposes only. Past performance is no guarantee of future returns. Real results may vary
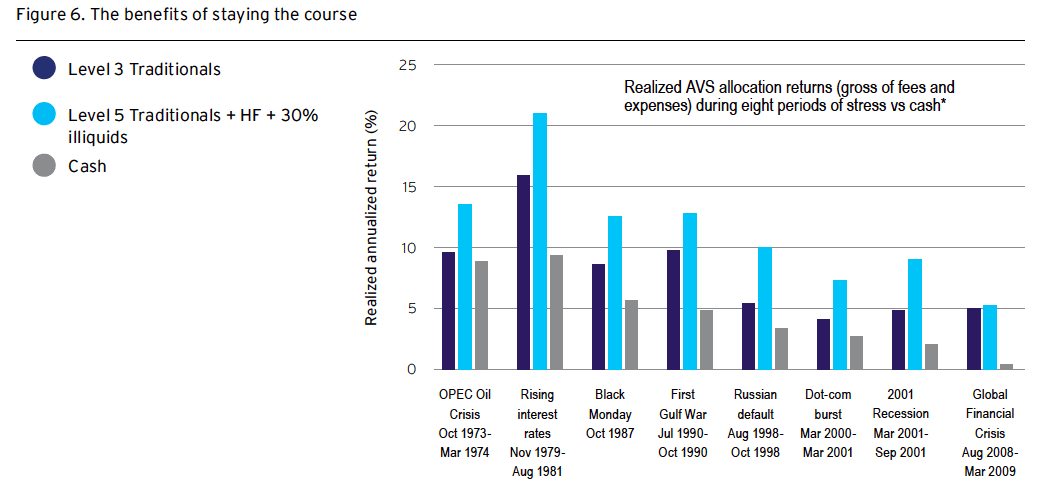
Holding excess cash is not riskless, nor does it increase portfolio returns. Aside from missing out on compound returns from holding risk assets, hoarding large amounts of cash exposes portfolios to the ravages of inflation. The Private Bank’s proprietary strategic asset allocation methodology – Adaptive Valuation Strategies – estimates an annualized return for cash of just 1.88% over the next decade. This is the lowest Strategic Return Estimate (SRE) of any asset class, with the exception of Commodities – figure 4. Nonetheless, we observe around one-third of clients holding more than 80% of their portfolios in cash and cash equivalents. And here’s the thing: even if a portfolio is implemented at the worst possible time, the benefits of staying the course with a globally diversified asset allocation are still available.
Figure 6 shows the ten-year performances of global allocations formed one month before the outbreak of major bouts of market stress, including the Global Financial Crisis of 2008-09. In all eight cases, such allocations went on to outperform cash significantly over time, despite the suffering substantial drawdowns almost immediately after their formation. Even if there is another bout of major market stress in the near future – which is possible, but not our expectation – we advise investors who are sitting on large reserves of cash to invest fully and invest now, and then stay the course. See our fixed income ideas in Make all of your cash work harder.
*The investor entered into an allocation one month before the beginning of a stress period, and stayed invested for 10 years. AVS is Citi Private Bank’s proprietary strategic asset allocation methodology, developed by our Global Asset Allocation team. Risk Level 3 seeks modest capital appreciation and, secondly, capital preservation, Risk Level 5 seeks maximum long-term growth of capital. Past performance is no guarantee of future results. Real results may vary.
After almost a decade of strong returns across many risky asset classes and markets, we understand that many investors are interested in preserving the gains they have made. However, this does not mean selling up and sitting on cash. There are other, smarter ways to mitigate the effects of volatility upon a portfolio, locking in profits, while also retaining exposure to any continuing market upside.
One possibility to consider is implementing a consistent hedging strategy. Hedging can help improve the risk profile of a portfolio and thereby reduce uncertainty. For example, an investor may be nervous about the S&P 500’s high long-term valuation, but reluctant to miss out on potential further gains. By implementing a strategy that will provide a payoff if the market falls by more than a certain amount, the investor can retain exposure to the index while limiting downside. There is a premium for hedging portfolios, but when market volatility is average or below average, it may be worthwhile.
The first step towards building your enduring portfolio is an analysis of your current allocation. Our Global Investment Lab will be happy to provide you with a short report that summarizes your present allocations and highlight how they diverge from our recommendations. Your Private Banking team can then work with you to help find appropriate ways to enhance your global diversification. We believe that the enduring portfolio you build in this way should form the core of your financial wealth. You can then pursue opportunistic investments beyond this core allocation, as we explore in the following article.
Gasan Abdulaev, Joe Kaplan, Paisan Limratanamongkol, and Malcolm Spittler also contributed to this article.
Six policy rate hikes from the Federal Reserve since December 2015 have pushed up short-term rates across Treasury Bills, commercial paper, and Libor instruments. Three-month US dollar Libor at 2.35% is now at its highest in ten years. If the Fed continued to raise rates as we expect, we believe Libor rates could rise another 100 basis points (bp) from current levels over the next 18 months. For the lower-risk portion of portfolios, we see many attractive options to make cash work harder in this environment.
A number of floating-rate fixed income markets have already benefited from Libor’s rise. They range from senior unsecured corporate bonds to non-agency residential mortgage-backed securities (RMBS). Typically lower in duration, these markets have shown relative stability throughout periods of elevated interest rate volatility. We continue to believe these assets can complement core portfolios by providing stable or rising income and relatively lower price sensitivity.
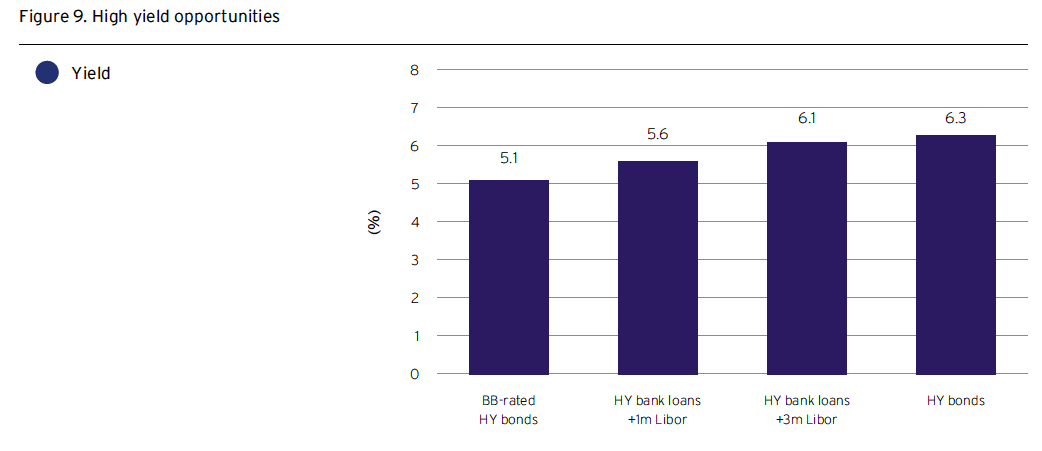
We also favor US high yield (HY) variable rate bank loan strategies run by third-party active managers. While issued by companies with lower credit ratings, these securities are typically secured loans and have a senior position in the capital structure. More importantly, their coupon payments float off US Libor rates. Along with the supportive corporate credit fundamentals backdrop, this has helped HY bank loans outperform both US HY bonds and equity markets year-to-date.
Still, investors should understand that technical factors are driving up Libor rates and how that may influence bank loan performance. The spread of 3-month Libor rates over 1-month rates has widened. In some cases where this has happened, issuers can switch the underlying base rate to the lower yielding option, which in turn produces a lower cash flow.
That said, we see HY bank loan-to-Libor spreads of around 370bp as still offering good value, especially in comparison to the spreads on higher quality BB-rated HY bonds.
While not wholly floating-rate, the active third-party strategies that participate in non-agency residential mortgage backed securities market (RMBS) can also benefit from rising short rates. Created by pooling various residential mortgage loan types, non-agency RMBS offer varying levels of risk, yield, and income generation. Although often associated with the 2008 Global Financial Crisis, market transparency has since improved and underlying risks are much more apparent. We expect non-agency RMBS to remain relatively insulated from heightened equity volatility.
Hybrid securities may also benefit from higher Libor. US fixed-to-floating rate preferred securities offer fixed-rate coupons for a certain period, during which the issuer has the option to redeem the securities at par. If not redeemed, these securities then float off Libor, plus a specified spread. Owing to rising long-term US Treasury yields and higher equity volatility, such securities’ prices have fallen in recent months. With hybrid yields-to-call back above 5%, we favor the US financial sector.
Finally, for US taxpayers, municipal debt across the yield curve remains attractively priced, with the long-term muni yield curve steepening. Net supply is expected to remain soft, pressuring yield ratios lower. Higher short-term rates look attractive and we favor both coupon and floating-rate opportunities. Shorter callable munis also provide an attractive yield pick-up.
Sources: Haver Analytics, Bloomberg Barclays Indices, S&;P as of May 2018. Benchmark high yield bonds and loan yield to worst (%). Past performance is not indicative of future returns. Real results may vary
Bonds are affected by a number of risks, including fluctuations in interest rates, credit risk and prepayment risk. In general, as prevailing interest rates rise, fixed income securities prices will fall. Bonds face credit risk if a decline in an issuer’s credit rating, or creditworthiness, causes a bond’s price to decline. High yield bonds are subject to additional risks such as increased risk of default and greater volatility because of the lower credit quality of the issues. Finally, bonds can be subject to prepayment risk. When interest rates fall, an issuer may choose to borrow money at a lower interest rate, while paying off its previously issued bonds. As a consequence, underlying bonds will lose the interest payments from the investment and will be forced to reinvest in a market where prevailing interest rates are lower than when the initial investment was made.
An investor cannot invest directly in an index. They are shown for illustrative purposes only. Past performance is no guarantee of future returns. Real results may vary. All forecasts are expressions of opinion and are subject to change without notice and are not intended to be a guarantee of future events. There may be additional risk associated with international investing, including foreign, economic, political, monetary and/or legal factors, changing currency exchange rates, foreign taxes, and differences in financial and accounting standards. These risks may be magnified in emerging markets. International investing may not be for everyone.
Strategies mentioned in this document may not be suitable for all investors. Strategies and services discussed herein may have eligibility requirements that must be met prior to investing. Each investor should carefully view the risks associated with the investment and make a determination based upon the investor’s own particular circumstances, that the investment is consistent with the investor’s objective. Products and strategies described herein involve risk and may not perform as described.