Steven Wieting, Global Chief Investment Strategist
Citi Private Bank does not share their stance. We think the global expansion may endure for longer than pessimists expect. And while we acknowledge the potential threats – particularly around trade – we advise that investors take more constructive and potentially profitable actions in their portfolios than simply retreating from risky assets. In our view, global GDP is likely to see decent growth in 2018 and 2019, with Citi Research forecasting around 3.5% for both years. If so, that would mark the strongest rate of growth of the whole expansion to date. Corporate earnings worldwide have exceeded our bullish expectations and look set to rise more than 15% in 2018. Admittedly, the US is at a later stage of its expansion than the rest of the world. However, it has also shown a reinvigorated capacity to grow. A rebound in the labor force, stronger investment growth, corporate tax cuts, and deregulation measures are all contributing factors. While some of these actions create risks of their own, we still expect positive momentum in the world’s largest economy for 2018 and beyond.
An imminent US business cycle peak looks unlikely - When will the US cycle peak?
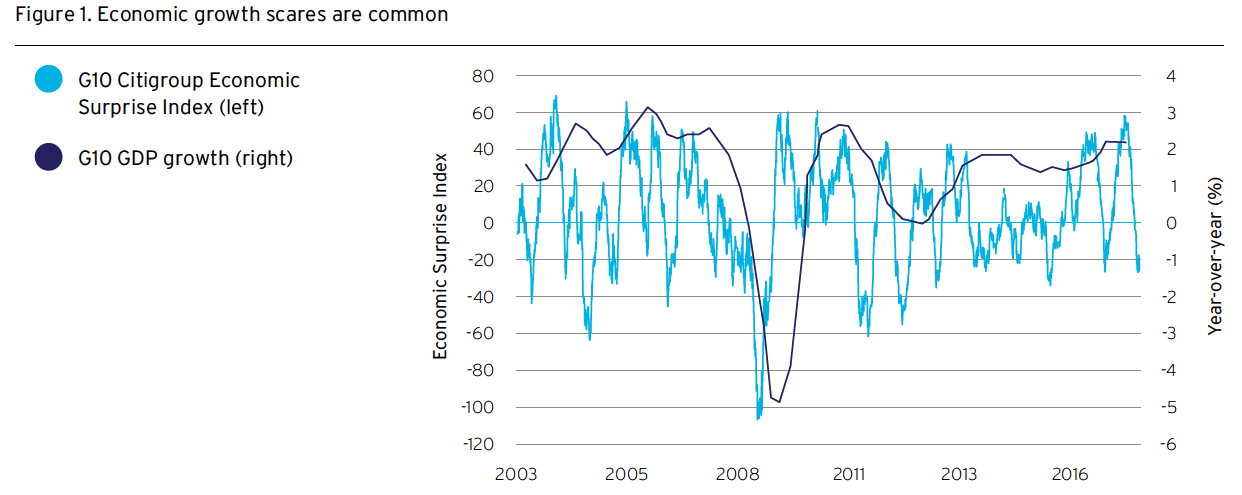
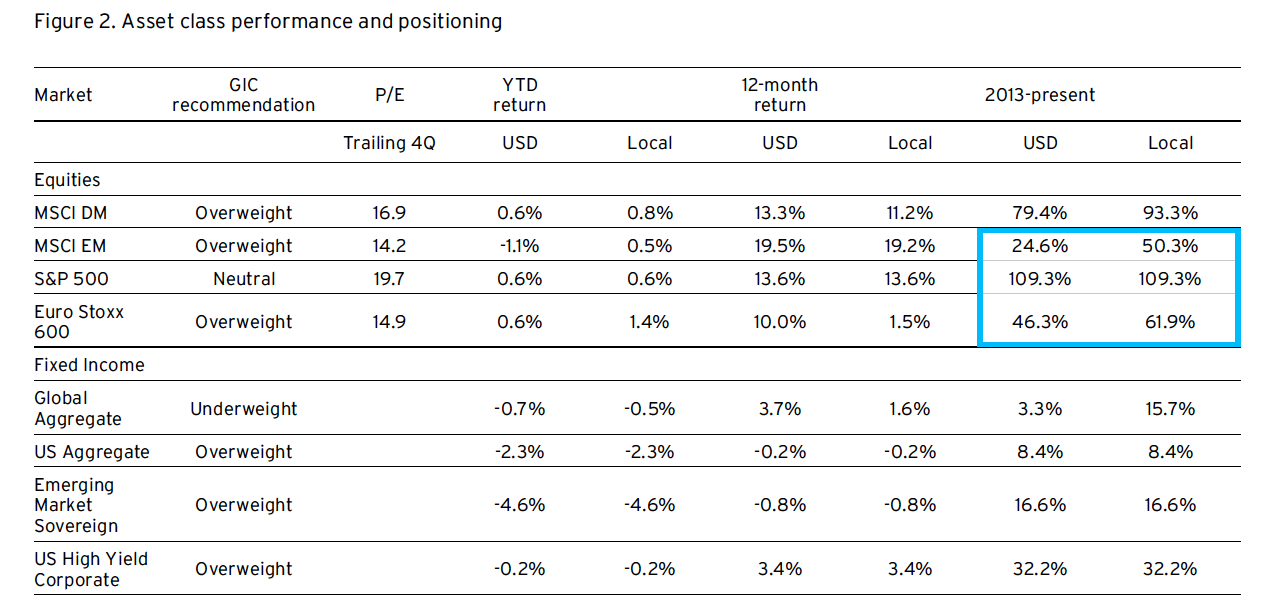
Remarkably strong and stable returns in 2017 fostered some bullish complacency. However, the shaky performance of financial markets in 2018 so far is inconsistent with our constructive global economic view. Growth scares, driven by downside surprises to short-term data, occur regularly, and demonstrably mean little to full-year economic performance – figure 1. The Citi Private Bank Global Investment Committee therefore remains 4% overweight global equities. Within that allocation, we continue to overweight many nonUS equity markets. This is based upon their significantly lower valuations, solid earnings prospects, and local economies that have not enjoyed the full recovery that the US has – see highlighted area in figure 2. By contrast, we are still neutral on US equities, despite a sharp recent improvement in valuations and rising US profits. Our global fixed income weighting remains underweight by 4% with a bias towards higher quality, low duration fixed income and cash equivalents in higher yielding markets. The single tactical change we made in early 2018 was to reallocate a portion of our overweight in US high yield to US investment grade fixed income after a sharp yield backup in both asset classes.
Source: Haver Analytics through May 8, 2018. G-10 Countries Real GDP Y/Y% vs Citi Economic Surprise Index. The G10 CESI is the Citigroup Economic Surprise Index covering the Group of 10 Countries. It objectively and quantitatively measures economic news. They calculated as weighted historical standard deviations of data surprises, defined as actual releases vs consensus. The G10 countries are the US, Japan, Germany, France, UK, Italy Canada, Switzerland, Sweden, Netherlands, and Belgium.
Source: Citi Private Bank Office of the Chief Investment Strategist, Haver Analytics, The Yield Book, through 8 May, 2018. See Glossary for definitions. Indices are unmanaged. An investor cannot invest directly in an index. They are shown for illustrative purposes only and do not represent the performance of any specific investment. Index returns do not include any expenses, fees or sales charges, which would lower performance. For illustrative purposes only. Past performance is no guarantee of future results. Real results may vary.
Despite being more positive than the more fearful consensus, we don’t dismiss some of the challenges that lie ahead for economies and markets. Trade protectionism, the rise of international friction, monetary tightening, and higher asset price volatility are some of the very real issues facing investors. However, we believe there is an appropriate way to prepare portfolios both for these and other challenges. This creates not only potential to manage risk but also to exploit improving opportunities. The world order has been shaken up in recent years. Particularly since the 2016 shocks of Brexit and the election of President Trump, policies favoring national self-interest have eclipsed international co-operation. Unilateral actions have gained ground over multilateral agreements. Nationalists from both the right and left have come to prominence in many countries, with various strongmen either consolidating their power or getting closer to office. We see all of this as part of a shift from a ‘multi-partner world’ to a ‘multi-polar world’, where several powers compete more and collaborate less. Consider that, for the first time since the post-war alliances were formed, the US may penalize European firms that do not comply with its Iranian sanctions regime. And consider that, in response, Europe may sanction firms if they do comply with US sanctions. We think these political and policy trends will have material implications for investors’ portfolios over the medium and long term.
Compare this with the situation just a few years ago. When the Global Financial Crisis of 2008-09 struck, policymakers worldwide coordinated efforts to stimulate economic growth and strengthen the financial system. They also vowed against a return to the damaging trade protectionism of the 1930s. If there were a fresh crisis tomorrow, it is hard to imagine such a level of international cooperation being repeated. And there is a risk that tariffs and trade restrictions will rise significantly for the first time in almost a century. As we warned in Outlook 2018, potential trade disruption from protectionism represents today’s biggest risk to global growth. The risks for certain countries are greater still.
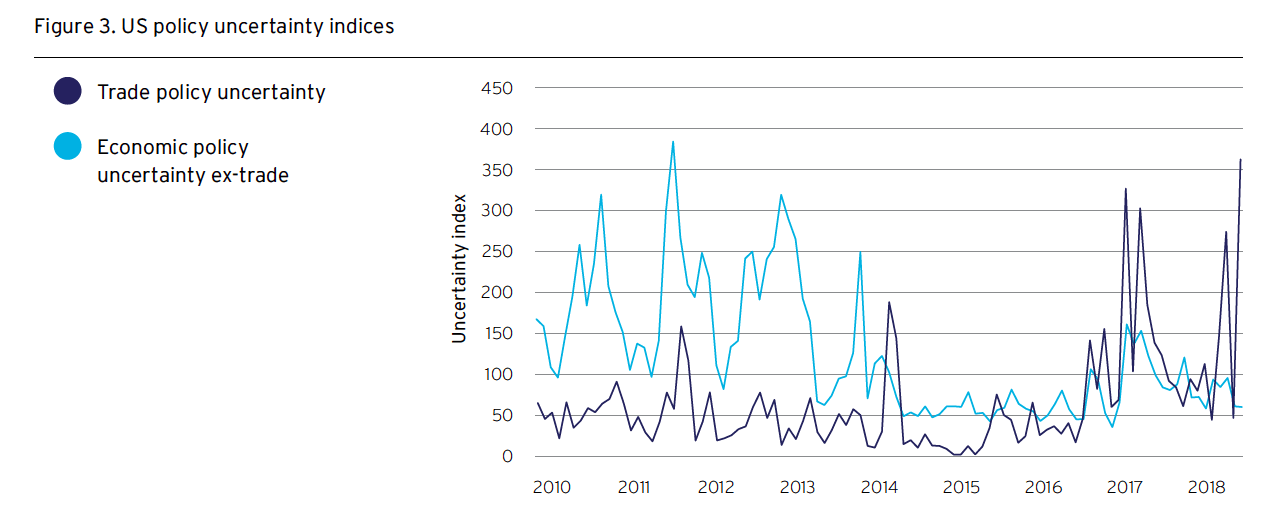
Trade fears are likely overblown Fears over international trade have already impacted equity markets globally in recent months, as uncertainty over US trade policy has hit a multi-year high – figure 3. Importantly, though, the global economy has yet to suffer negative effects. In the US, uncertainty over economic policy overall remains fairly low. Bilateral negotiations between the US, China, Mexico, and Canada regarding their future trade relationships all show tentative signs of progress. Although legitimate, concerns at the global level over a potential trade war seem overdone to us, particularly as such a conflict would create opportunities for many to exploit and displace those who became subject to bilateral country tariffs.
Meanwhile, international friction and protectionist domestic policies remain a topical threat for the nearterm. Mexico’s leading presidential candidate Andres Manuel López Obrador supports ending the privatization of the national oil monopoly and hopes to face down Trump in trade negotiations if he wins the country’s 1 July presidential election. In Brazil, certain candidates on both the far left and far right have argued for nationalizing particular industries. In India, Prime Minister Modi faces a growing regional backlash against the rule of his Hindu nationalist party. The phenomenon is not confined to emerging markets. President Trump – a self-confessed admirer of hardline leaders elsewhere who ‘get things done’ – has lashed out against numerous firms over particular business practices. In other cases, he has boosted them in an equally unpredictable fashion.
Source: Haver Analytics through April 2018. Uncertainty indices are derived using terms from over 2,000 US newspapers by scanning for language stressing uncertainty around various policy event types. “Non-trade” is a simple average of the following separate indices: Monetary Policy, Fiscal Policy, Taxes, Government Spending, Healthcare, National Security, Entitlements, Regulation, Financial Regulation, Debt and Currency issues.
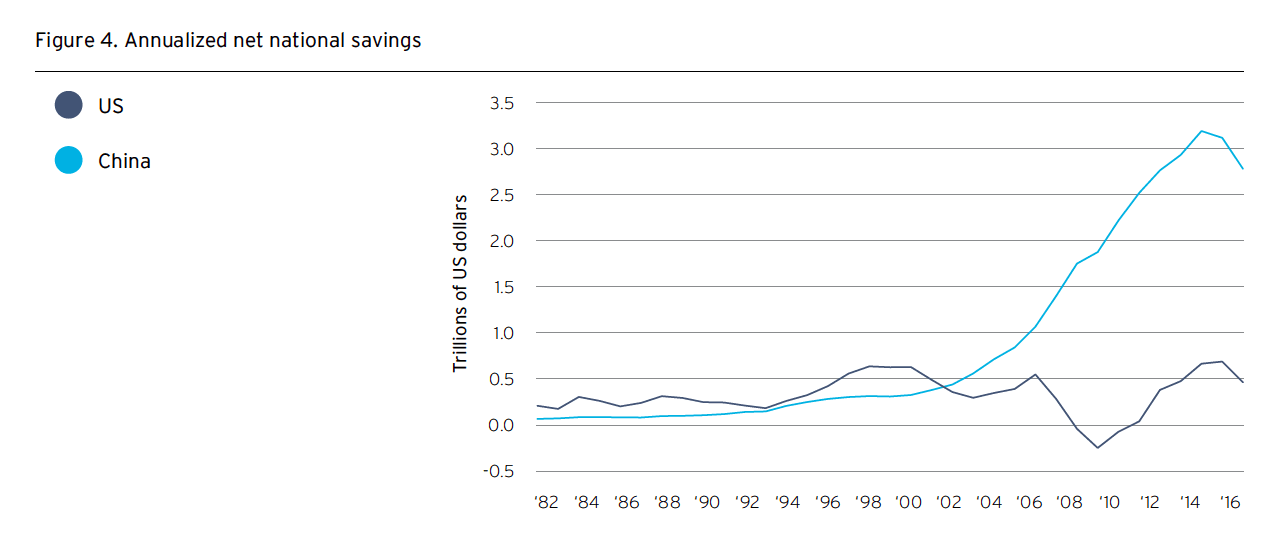
In light of this, we ask quite simply, how many eggs should an investor have in any one strongman’s basket? For many investors who invest only in one country or region, the combination of strongmen, trade tensions, and other factors have raised their risks. While national economies may experience only limited damage in the event of future trade restrictions, particular sectors and companies would suffer a great deal more. The case for global diversification in today’s multi-polar world has therefore become even more compelling. And yet, our own data shows that around 80% of Private Bank clients remain overly concentrated in a single currency in their investment holdings. China represents one particular area where we see most international portfolios underexposed. Global investors remain reluctant to invest in the country, perhaps scarred by memories of the turbulence in its equity markets in 2015 and 2016. However, China’s fundamentals are positive, with rapid technological innovation, a growing middle class powering consumer spending, and increasingly disciplined state-owned industries. Net national annual savings far exceed those of the US, greatly mitigating perennial debt concerns – figure 4.
Given President Xi Jinping’s autocratic move to allow himself to stay in power for life – and the country’s trade standoff with the US – it may seem controversial or uncomfortable to add to China exposure. Our point, however, is that China is a vital pole in today’s multipolar world. Its importance will likely increase further in coming years. It deserves a place in a global diversified allocation – along with assets from many other countries.
Going into 2018, we expected higher rates across developed and emerging markets. We thought that the US Federal Reserve’s reduction in its bond holdings would create competition for funds, requiring increased private savings to finance US government borrowings. We believed this demand for increased savings would push interest rates higher and attract inflows from other asset classes, creating market volatility. Rates have indeed risen, with the US 10-year Treasury yield notably breaching the 3% level for the first time in over four years.
Source: Haver Analytics as of 15 May 2018
US monetary policy tightening will become increasingly relevant for investors over time. With the significant premium of US yields over other developed yields, we continue to expect a range-bound US dollar in 2018, with ‘counter-trend’ recoveries. However, our longerterm outlook is for the US dollar to resume its 2017 downtrend. We do not believe that the US economy will sustain rising short rates much beyond 2019. The likelihood of further multi-year dollar declines is one of the reasons we favor non-US equities over US equities.
We also tactically overweight the front end of the US yield curve in order to take advantage of the rise in Federal Reserve policy rates, which has made many short-term interest rate products attractive. Floating rate US fixed income looks increasingly appealing as the Fed expects to brings its funds rate up to 2.75% by end 2019.
Also see - Build an enduring global investment portfolio now.
After an unusually long period of calm in financial markets, our expectation was for volatility to return in 2018. We set out our views in Exploiting volatility in Outlook 2018 and also highlighted ways to help protect portfolios and seek to generate returns from the expected trend. Just a few weeks into the year, implied volatility surged as investor sentiment turned fearful and strategies to generate income from falling volatility were broadly abandoned.
With continuing monetary tightening and the potential for market volatility from trade tensions, we expect volatility to remain structurally higher for the rest of the cycle. Hedging strategies for unusually large market moves remain an attractive option in our view. However, we see a different opportunity-set than we did going into 2018. In some cases, we are attracted by the potential of generating income by volatility-selling strategies, where the seller receives income and can potentially make a profit if volatility falls or stays contained at now higher levels. In the event that it rises, however, the seller faces potential losses. In idiosyncratic cases, such as the Mexican election, we would expect currency market volatility to move higher - see Identifying opportunistic investments for enduring portfolios.
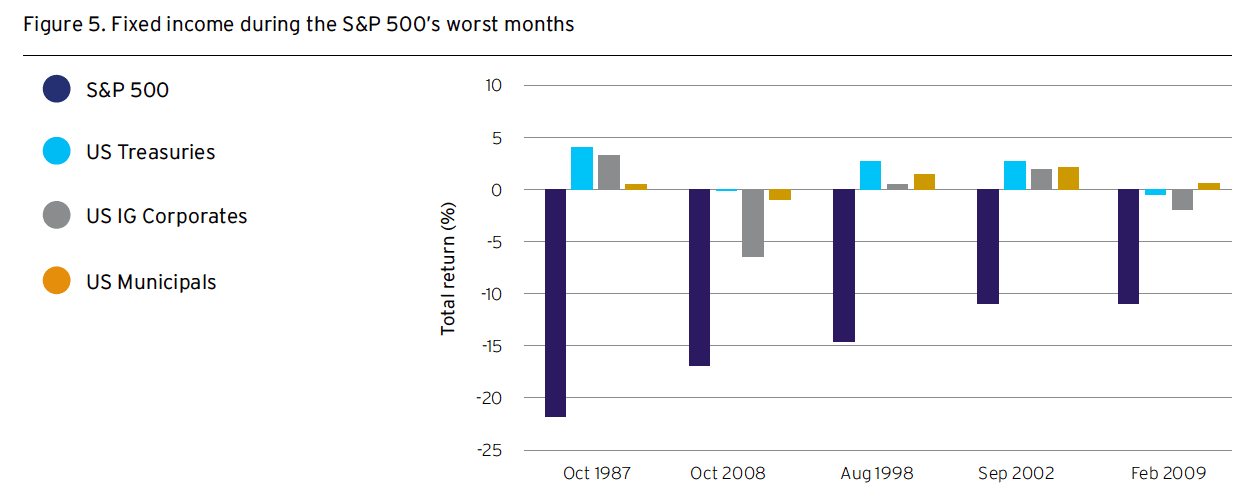
As many investors began the year doubting the value of fixed income in portfolios, we would also emphasize that various fixed income assets have been the best performing globally in four of the last eleven years since the last economic peak in 2007. Also, fixed income has also proved a useful diversifier during many of the worst months for US equities over the last few decades – figure 5. The lowest yields in history linger in much of Europe and Japan. Avoiding these countries’ markets creates portfolio capacity to own both equities and fixed income assets with sturdier yields elsewhere.
Source: Haver, as of 8 May 2018. Indices are unmanaged. An investor cannot invest directly in an index. They are shown for illustrative purposes only and do not represent the performance of any specific investment. Index returns do not include any expenses, fees or sales charges, which would lower performance. Past performance is no guarantee of future results. Real results may vary
Almost halfway through 2018, we continue to see significant opportunities – but also risks – for investors arising from today’s multi-polar world. We would stress that many of the risks are highly localized in nature. The most appropriate response is to build portfolios that are broadly diversified by geography and asset class. In Outlook 2018, we highlighted that in the past two decades, global equities outperformed regional equities in specific crisis years by an average of 33%, In the articles that follow, we consider some key principles for such portfolios, as well as some specific strategies for them.
The US business cycle has traditionally been a bellwether for the world economy. In the last nine years, the US has experienced the strongest recovery among developed market economies, albeit a weaker one than its own previous recoveries. And, in an unusual experiment, the US reinvigorated its late-stage expansion in the last year with deregulation and tax cuts. As a result, the US is living beyond its means. Its budget deficits are worsening at a point of the cycle when they would typically improve.
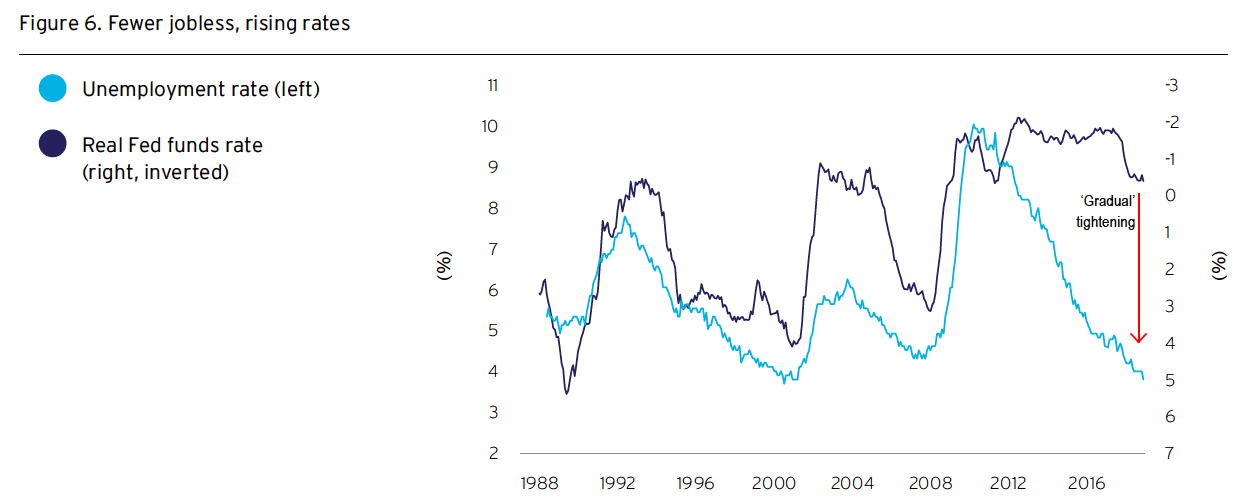
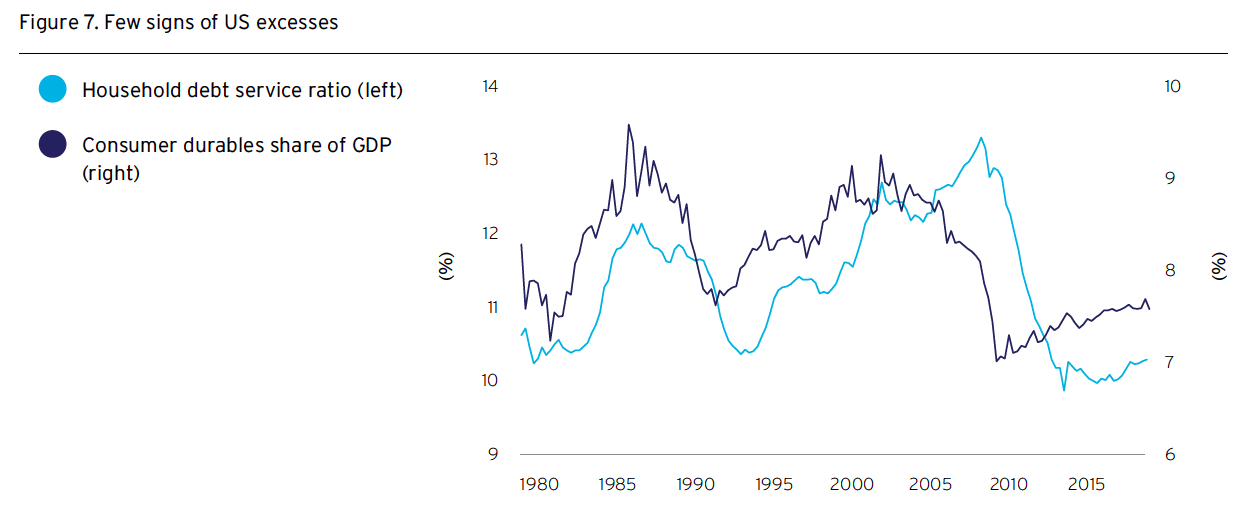
The trifecta of an ageing US business cycle, tightening monetary policy and larger current deficits means the likelihood of a near-term US business cycle peak is more than just theoretical. US unemployment has fallen as low as it generally ever does at an economic peak – figure 6. However, the economy also has never seen such modest wage and consumer price pressures at similar historical points. As a result, the Federal Reserve is tightening policy unusually gradually. Other factors are also consistent with ongoing US growth. Households are much less financially stretched than they were ahead of the last two recessions, while we see no excesses in demand – figure 7. And finally, we believe that the next downturn, whenever it occurs, should be nowhere near as severe as that of 2008-09.
To give some perspective on how the Fed will handle any such recession, bear in mind that in previous downturns, the Federal Reserve has responded by cutting interest rates by several percentage points. But nominal rates are unlikely to be sufficiently high by the start of the next recession for this to happen. That said, the Fed’s current balance sheet reduction program should create room to deliver monetary stimulus in the future by restarting bond purchases. If necessary to support the economy, it may be able to purchase $1 trillion of assets without exceeding its prior peak in holdings.
So, when might the mild next downturn that we expect finally begin? Given the rebounding labor force, strengthening business investment, and gradual monetary tightening, we think a US business cycle peak before the end of 2019 is unlikely. We see tepid financial market performance in 2018 to date as at odds with the genuine prospects for continuing growth, both in the US and elsewhere.
Source: Haver, as of 8 May 2018