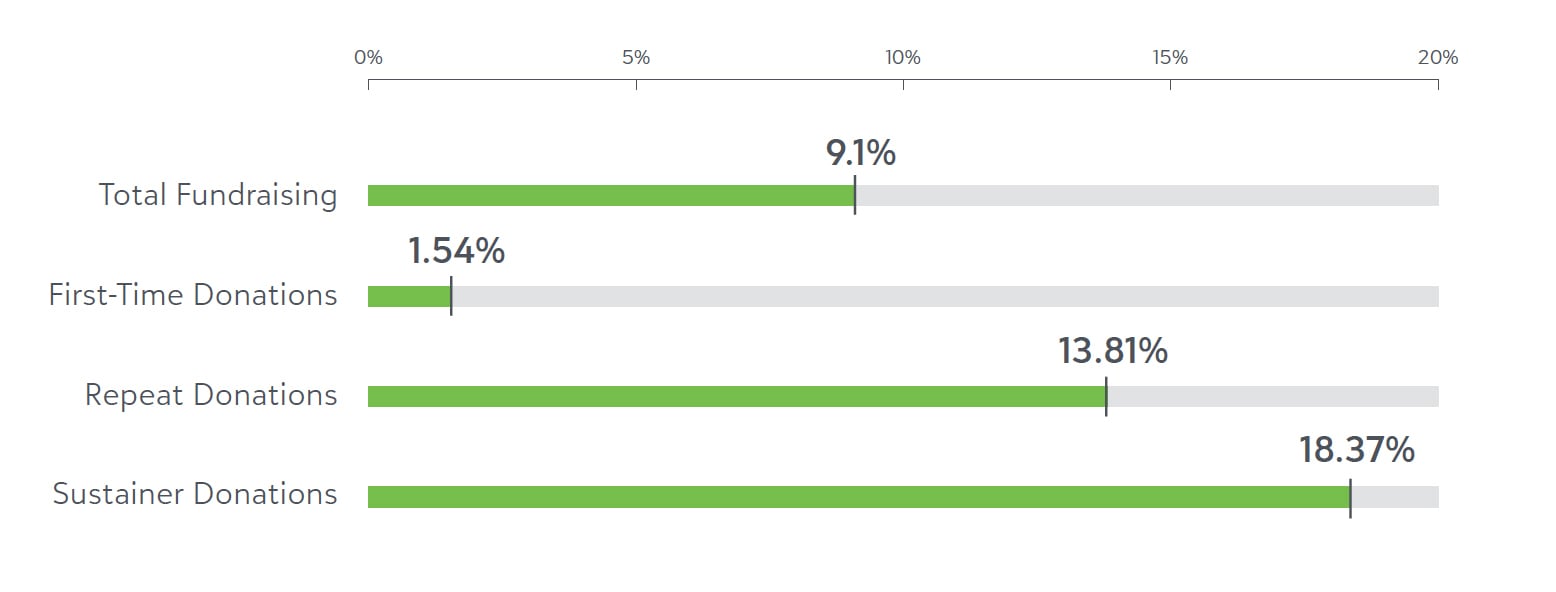
Monthly giving revenue grew by 18.37% overall, with some vertical sectors showing 20–40% growth.
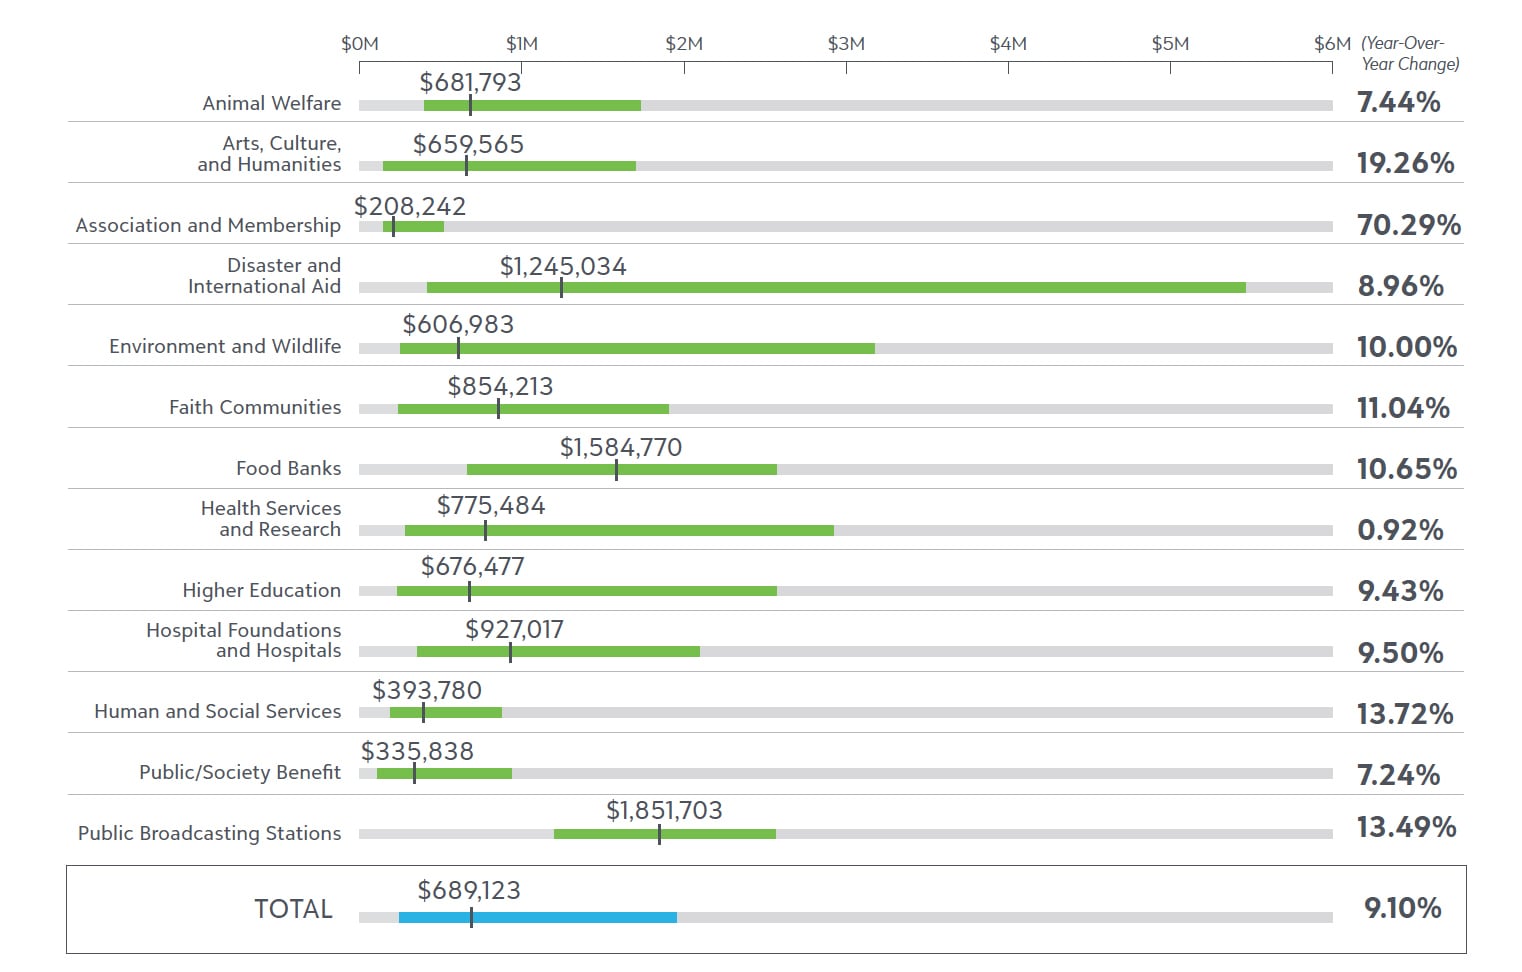
We saw online fundraising rise by a healthy 9.1% in 2018. Most vertical sectors, showed double-digit growth, led by Arts, Culture, and Humanities with 19.25%, Human and Social Services with 13.72%, and Public Broadcasting with 13.49%. You can see the full breakdown by vertical in the Fundraising Revenue by Vertical chart on the next page.
Last year’s exuberant growth that followed in the wake of political and social upheavals after the 2016 elections seems to have stabilized. Organizations in sectors that raised substantially more revenue last year appear to have channeled this momentum into their sustainer programs. Monthly giving revenue grew by 18.37% overall, with some vertical sectors showing 20–40% growth. This reflects an important strategic emphasis on building relationships with donors and growing sustainer programs to build a steady, predictable supporter base for your missions.
With retention going strong (powered by sustainers), first-time giving is experiencing the inverse. Firsttime giving as a proportion of total online giving was down at a median rate of -6.25%, managing to grow a modest 1.5% in year-over-year revenue in spite of fewer transactions.
In these charts, we look at the type of gifts that make up the overall online giving mix. Each online gift is either first time or repeat, and each gift is also either sustainer or non-sustainer. First-time transactions are from new constituents, while repeat gifts are from established constituents. Sustainer transactions are from recurring (monthly) gifts that might be from new or established (repeat) donors. The percent change metrics refer to how the balance has shifted over the last year.
(Total Online Transaction Revenue Year-Over-Year Change)
(Total Online Transaction Revenue)